

Maximise Power BI Performance: Strategies for Data Optimization
In the realm of business intelligence, Power BI stands out as a powerful tool for data visualisation and analysis. However, maximising its potential requires more than just basic usage. Power BI reports rely heavily on the quality and efficiency of the data they connect with. Yet, there are instances where the required data is not readily available or does not align with report requirements. In such cases, developers resort to manual adjustments, risking inefficiency and unsustainability in the long run. As datasets grow in size and complexity, ensuring optimal performance of Power BI reports becomes increasingly crucial. Power BI developers need to dedicate significant efforts to optimising this transformation process to achieve the best possible report performance. To truly leverage its capabilities, it is imperative to optimise the way you use your data.
We asked our Power BI experts at EiSquare for tips on how they can prioritise and ensure data optimisation in their projects. In this blog, we'll explore various techniques you can implement to ensure your clients receive reports that not only provide valuable insights but also operate with maximum efficiency and effectiveness.
Foundation of data optimisation in Power BI:
1. Data Source Parameters
- Store Power BI data sources in parameter variables; this will allow you to dynamically adjust data connections and queries within Power BI reports and datasets. These parameters are particularly useful when reports need to change data sources or connection settings without modifying the report or dataset structure manually. It is also highly convenient when you require a quick test of different datasets within reports.
2. Simplify Data Models
- Streamline data models by reducing unnecessary relationships and eliminating redundant tables. Too many relationships between tables can lead to increased query complexity and slower performance.
- Use bi-directional filtering sparingly and consider converting relationships to one-directional where appropriate.
- Normalise data by breaking it down into smaller, logically organised tables. These smaller tables can be re-used / shared by different reports. This approach reduces data duplication and ensures data consistency across the model. A leaner data model improves query performance and simplifies report development.
3. Tables/Views Optimisation
- Begin the ‘data pre-processing’ stage by having your raw data meticulously processed and prepared by a dedicated team of data engineers and analysts.
- Before moving to Power BI, whenever apply filters and transformations at the data source level rather than within Power BI. This approach minimises the amount of data transferred to Power BI, improving query performance, and reducing resource consumption.
- For instance, EiSquare reports exclusively use data from the gold layer Views within the respective environment. This data has already undergone thorough pre-data cleaning processes.
Nevertheless, despite this preprocessing, the data often requires further refinement by Power BI developers to precisely align with the specific report requirements, surpassing the scope of data engineers' initial tailoring.
Need a hand fine-tuning your Power BI reports to fit your unique needs? Contact us now to tap into our expertise and streamline your data refinement process.
To significantly enhance report performance, developers can employ the following essential data optimisation steps:
(i) Column Removal Process: Review all tables/views to identify and eliminate redundant columns that is not pertinent to the report's requirements. This step will streamline the dataset by discarding extraneous fields. By trimming down the dataset, we not only reduce the file size but also ensure swift execution and seamless operation.
(ii)Row Filtering Procedure: Scrutinise each column to filter out extra/irrelevant rows. It is imperative to note that this filtering process should be conducted at an early stage, preceding any subsequent data transformation steps. By implementing this filter operation, we efficiently reduce the dataset's size and enhance the runtime of the report.
(iii) Table/View Merging: The merge function combines data from multiple sources into a single table or view; which provides a template/blueprint for how other tables or views can be organised or structured. Before merging, it is crucial to streamline the referenced table/view by retaining only relevant fields and unique values (remove duplicates). After the merge, (usually done through an inner join) any unnecessary rows are eliminated. Then, redundant columns resulting from the merge are removed to improve clarity. This plays a crucial role in preventing potential blanks in filters enhancing the overall reliability and effectiveness of the dataset.
(iv)Table Aggregation: Wherever possible, use aggregation tables to pre-calculate summarised data, especially for large datasets. Aggregations accelerate query execution and enhance report responsiveness, particularly for complex calculations and visuals. Limit the use of calculated columns to essential calculations that cannot be performed efficiently in measures. Excessive calculated columns can increase model complexity and slow down data refresh and query processing.
4. Avoiding Generated Data
- Power BI is primarily designed for data visualisation and analysis, not data generation or processing. In some cases, the necessary data for a specific report might not be readily available or directly usable to fulfil the report's requirements. Although Power BI provides robust features such as creating measures and incorporating calculated or conditional columns, these solutions are typically implemented by developers based on immediate conditions and scenarios.
- It’s also important to recognise that these measures, added columns, or textual annotations are static. Meaning as situations evolve over time, there's a risk that the conditions or definitions applied to these elements may no longer align with the changing scenarios unless developers manually update them. This manual adjustment process can prove to be inefficient and unsustainable in the long term.
Example:
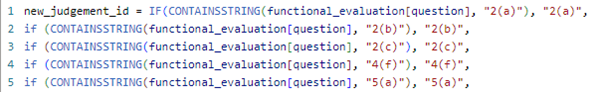
- The above example carries inherent risks when new scenarios emerge in the future, such as the addition of "3(a)" or "4(a)." Without manual adjustments, these new additions may go unnoticed and fail to be accounted for in the existing framework.
- To mitigate this risk, refrain from generating new 'static' data within Power BI. Instead aim to fully utilise the existing data possible.
For instance:

Replace writing a text note by introducing existing table data – when data values changed, the text will auto change accordingly.
Undertake data transformation processes, such as splitting or merging existing columns, to generate desired 'new' fields within the dataset. These 'new' fields are dynamically integrated into the dataset, ensuring they adapt and evolve over time as needed.
Customise tables/views directly from the data source to retrieve the necessary fields required for specific report objectives. This approach also helps circumvent the need to generate 'new' data within Power BI.
5. Simplify Row-Level Security (RLS)
Design the data model in Power BI to accommodate the security requirements. Ensure that the data model includes the necessary tables and relationships to support RLS implementation effectively.
When implementing row-level security (RLS) with multiple filters across disparate tables or views, managing security roles becomes cumbersome. Each role typically needs to select from various tables to define their restrictions. Additionally, when dealing with multiple fact tables, connecting these tables or views to apply RLS can significantly complicate the data model.
To address these challenges and optimise the performance of RLS, we recommend creating dedicated tables or views in the data source to store all security-related information by introducing a dim RLS table or view can streamline the process. This dim RLS entity consolidates all filter restriction fields required into a single location. By centralising these filters, each security role only needs to connect to this one table, regardless of the number of fact tables in the model.
When necessary, define role-based security rules using DAX (Data Analysis Expressions) filters or Power Query filters. These rules should dynamically filter data based on the user's role or attributes, ensuring that users can only access authorised data rows.
Let’s recap:
- Power BI data source parameters offer a flexible and powerful mechanism for customising data connections, testing and data refresh processes within Power BI reports and datasets.
- Simplifying the data model in Power BI is crucial for improving report performance, enhancing development efficiency.
- Optimising tables/views by removing unnecessary columns, filtering rows and merging/aggregating tables will significantly enhance report performance and reduce file size.
- By avoiding data generation within Power BI and adopting best practices for data preparation and transformation, you can ensure better performance, maintain data consistency, and simplify report maintenance and scalability.
- Efficiently setting row-level security (RLS) in Power BI simplifies the management of security roles and ensures consistent application of row-level restrictions across the entire data model.
Data form the backbone of Power BI reports; with a thorough understanding of these optimisation techniques, businesses can unlock the full potential of Power BI for data-driven decision-making, driving success in an increasingly competitive landscape. Sounds overwhelming? With decades of experience in data optimisation and Power BI utilisation, EiSquare is well-positioned to assist you in creating high performing and agile reports. Give us a call today and we can guide the way.